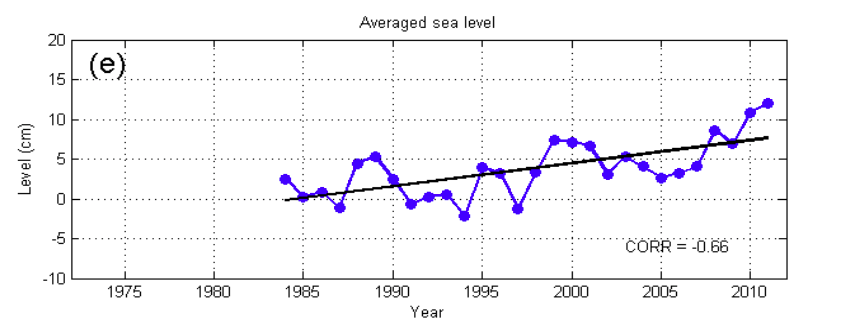
Warming of seas will usually lead to thermal expansion of sea water and widespread loss of land ice. Hence, global sea levels are rising. Singapore is no exception. As shown below, the sea level in the Straits of Singapore has been increasing over the past few years. This was analysed from records from 4 of the longest tide gauges. They are Tanjong Pagar, Sembawang, Raffles Lighthouse and Sultan Shoal. There has been an average of 2.9mm rise per year since 1984…
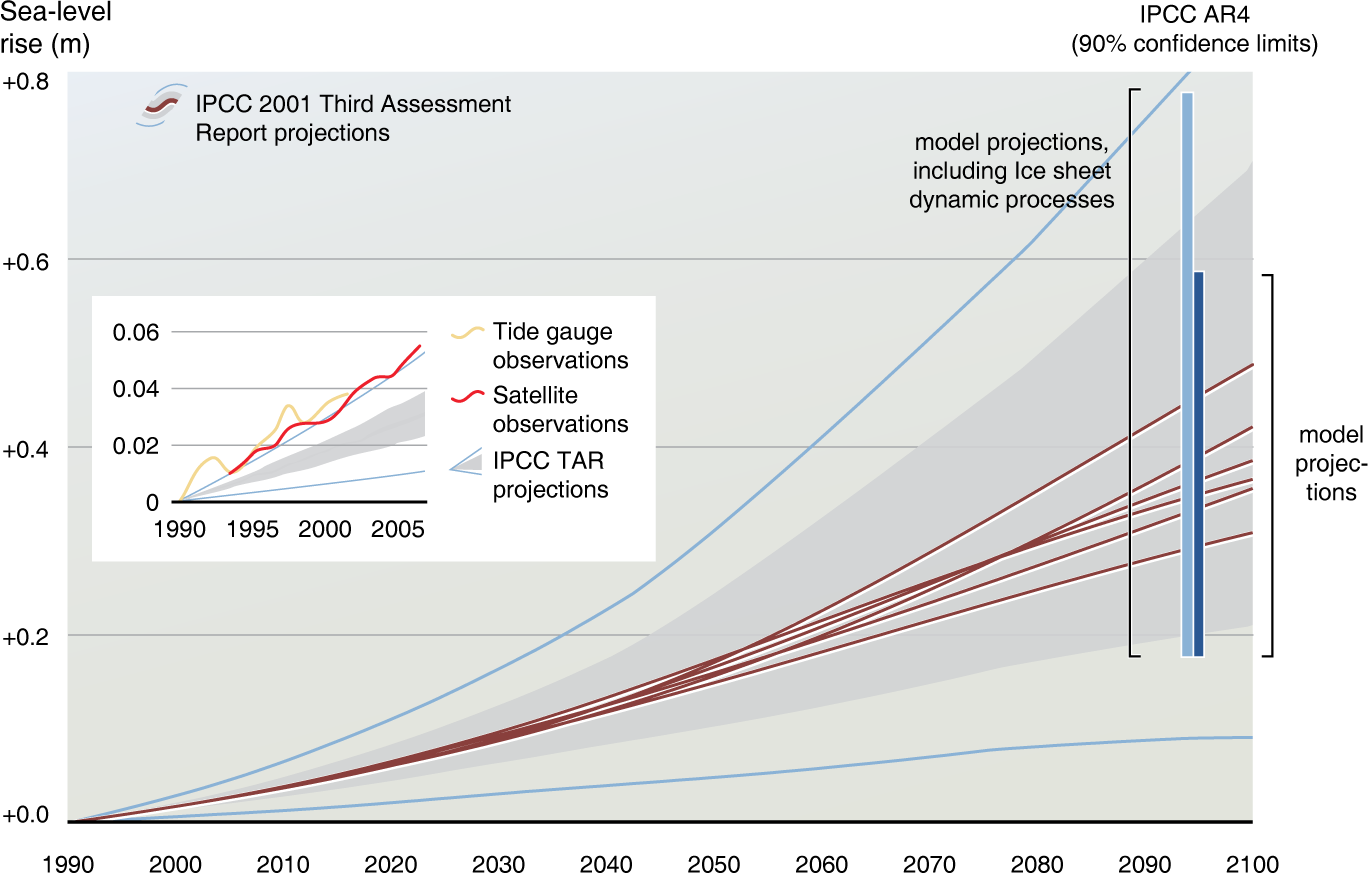
Despite so, our sea level is projected to rise by another 0.25 – 0.76m by the end of the century. This is in line with global projected sea level rise.

Being a low-lying land, a rise in sea level is one of our most immediate concerns. This is particularly so as most of our land lies only 15m above the mean sea level. About 30% of land lies merely 5m above mean sea level!
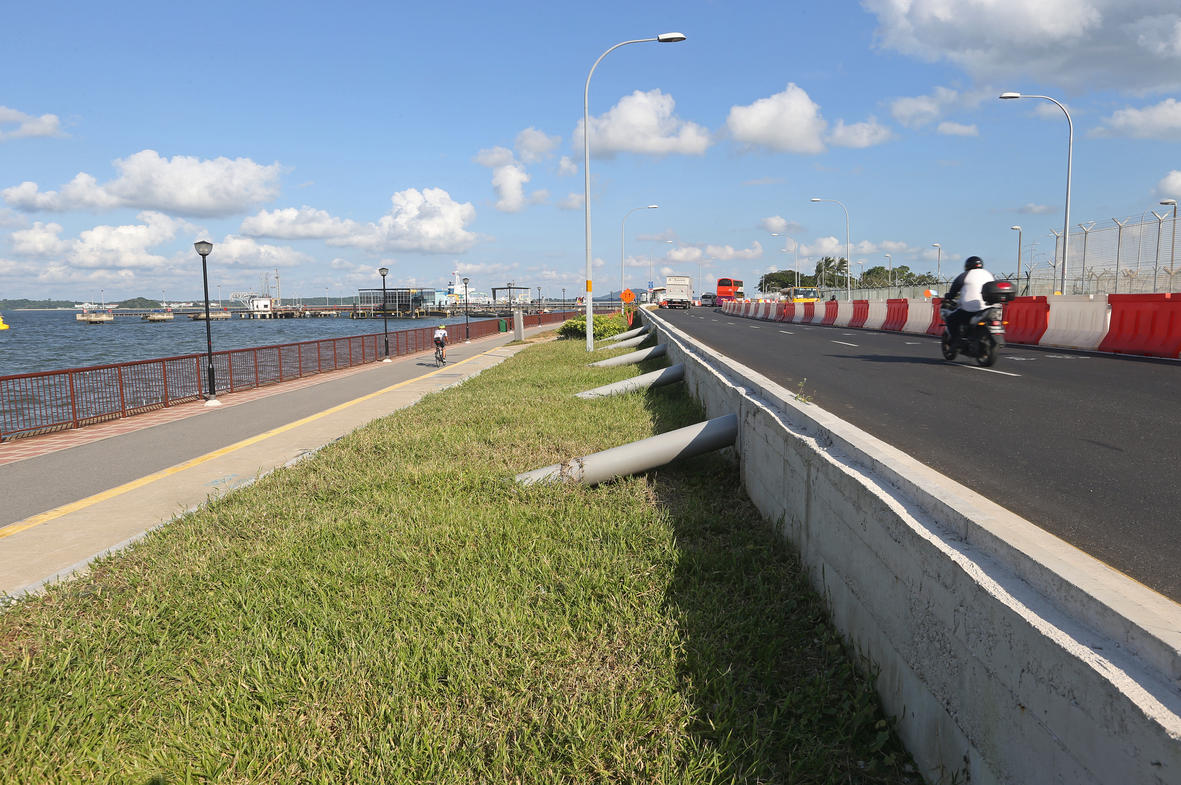
We can definitely see how the Singapore government has actively taken steps to tackle the resulting effects e.g. coastal erosion and contamination of reservoirs from sea water. Today, over 70% of Singapore’s coastlines are protected with hard structures e.g. seawalls.

Currently, there are studies investigating natural methods such as mangroves to protect coastlines. Also, one of the projects under Building and Construction Authority (BCA) presently looks at developing coastal protection measures. These show the imminent threat that Singapore faces towards being “underwater”.
An interesting study was conducted by Ng and Mendelsohn (2005) regarding the impact of sea level rise on Singapore. They utilised the concept of environmental economics, attributing money value to nature. From their analysis (shown below), it can be seen that if sea level rise is not managed well, it could lead to significant costs.
Firstly, they focused on the commercial and business district (CBD) area – one of the highest-valued regions in Singapore. Hence, the analysed the cost if such land is inundated in future. It can be seen that it involves significant amounts – measured in millions of 2000 SGD!
| Value of inundated land | |||
| Year | 0.2m | 0.49m | 0.86m |
| 2000 | 36.62 | 80.56 | 146.47 |
| 2010 | 65.91 | 168.44 | 292.93 |
| 2020 | 102.53 | 248.99 | 439.40 |
| 2030 | 139.14 | 329.55 | 585.86 |
| 2040 | 168.43 | 417.43 | 732.33 |
| 2050 | 205.05 | 497.98 | 878.79 |
| 2060 | 234.34 | 585.86 | 1,025.26 |
| 2070 | 270.96 | 659.10 | 1,171.72 |
| 2080 | 307.58 | 746.97 | 1,318.19 |
| 2090 | 336.87 | 834.85 | 1,464.66 |
| 2100 | 373.49 | 915.41 | 1,603.80 |
| Note: These estimates include projected increases in land values. | |||
Next, they examined the cost of coastal protection structures for such land. The amount is also significant – millions of SGD!
| Sea level rise scenario | |||||||||
| 0.20m | 0.49m | 0.86m | |||||||
| Year | CC | MC | TC | CC | MC | TC | CC | MC | TC |
| 2000 | 0.02 | 0.008 | 0.03 | 0.15 | 0.05 | 0.20 | 0.46 | 0.15 | 0.61 |
| 2010 | 0.03 | 0.010 | 0.04 | 0.19 | 0.06 | 0.25 | 0.57 | 0.19 | 0.76 |
| 2020 | 0.04 | 0.014 | 0.06 | 0.26 | 0.09 | 0.35 | 0.80 | 0.26 | 1.07 |
| 2030 | 0.06 | 0.018 | 0.07 | 0.33 | 0.11 | 0.45 | 1.03 | 0.34 | 1.37 |
| 2040 | 0.07 | 0.022 | 0.09 | 0.41 | 0.13 | 0.54 | 1.26 | 0.42 | 1.68 |
| 2050 | 0.08 | 0.027 | 0.11 | 0.48 | 0.16 | 0.64 | 1.49 | 0.49 | 1.98 |
| 2060 | 0.09 | 0.031 | 0.12 | 0.56 | 0.18 | 0.74 | 1.72 | 0.57 | 2.28 |
| 2070 | 0.11 | 0.035 | 0.14 | 0.63 | 0.21 | 0.84 | 1.95 | 0.64 | 2.59 |
| 2080 | 0.12 | 0.039 | 0.16 | 0.71 | 0.23 | 0.94 | 2.18 | 0.72 | 2.89 |
| 2090 | 0.13 | 0.043 | 0.17 | 0.78 | 0.26 | 1.04 | 2.41 | 0.79 | 3.20 |
| 2100 | 0.14 | 0.047 | 0.19 | 0.86 | 0.28 | 1.14 | 2.63 | 0.87 | 3.50 |
| Notes: The decadal total costs (TC) of protection include the construction costs (CC) of the hard structures and the maintenance costs (MC) involved. These values have been discounted to the present values within each decade, at a discount rate of 4 per cent. | |||||||||
Applying this predictions to all of Singapore’s coastal sites, they derived the total economic impact on Singapore in future from such sea level rises.
| 2050 | 0.2m | 0.49m | 0.86m |
| Potential land inundated | 2.23 | 5.45 | 9.56 |
| Decadal value of land | 1,872 (1,040) | 4,539 (2,521) | 7,980 (4,433) |
| Decadal protection cost | 5.58 (3.10) | 33.49 (18.61) | 103.17 (57.32) |
| 2100 | 0.2m | 0.49m | 0.86m |
| Potential land inundated | 3.96 | 9.70 | 17.02 |
| Decadal value of land | 6,769 (3,760) | 16,599 (9,221) | 29,090 (16,161) |
| Decadal protection cost | 16.40 (9.11) | 98.42 (54.68) | 303.19 (168.45) |
| Present value of protection costs | 0.30 (0.17) | 1.80 (1.00) | 5.55 (3.08) |
| Notes: The areas of potential land inundation are presented in sq km. The values of land and related discounted values are in millions of 2000 SG$ with millions of 2000 US$ in parentheses. | |||
If sea levels are to continue rising for another 100 years…look at the enormous monetary amount for 2100 under the 3 sea level rise scenarios!
Attribution of monetary terms to nature helps us to see the true effect of our actions. In this case, we could see how our actions indirectly impact land value and costs.
