Permutation Test on Native Language Background
- Germanic Speaker VS Slavic Speaker
1) Experiment Set up
Null Hypothesis: The native Germanic speaker does not have better fluency score than Slavic speaker.
Alternative Hypothesis: The native Germanic speaker has better fluency score than Slavic speaker.
Number of permutation: 50000
Alpha level: 5%
2) Result and Analysis
p-value: 0.00005
The p-value is smaller than the alpha value, we have to reject the null hypothesis. Thus, the native Germanic speaker has better fluency score than Slavic speaker.
- Germanic Speaker VS Romance Speaker
1) Experiment Set up
Null Hypothesis: The native Germanic speaker does not have better fluency score than Romance speaker.
Alternative Hypothesis: The native Germanic speaker has better fluency score than Romance speaker.
Number of permutation: 50000
Significant level: 5%
2) Result and Analysis
p-value: 0.00001
The p-value is smaller than the alpha value, we have to reject the null hypothesis. Thus, the native Germanic speaker has better fluency score than Romance speaker.
- Slavic Speaker VS Romance Speaker
1) Experiment Set up
Null Hypothesis: The native Slavic speaker does not have better fluency score than Romance speaker.
Alternative Hypothesis: The native Slavic speaker has better fluency score than Romance speaker.
Number of permutation: 50000
Alpha level: 5%
2) Result and Analysis
p-value: 0.00002
The p-value is smaller than the alpha value, we have to reject the null hypothesis. Thus, the native Slavic speaker has better fluency score than Romance speaker.
- Result summary
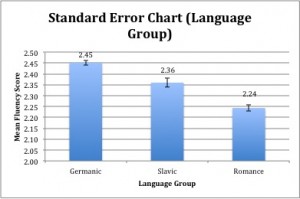
Figure 14 Standard Error Chart (Native Language)
The results from the three experiments are summarized in Figure 14. As shown in Figure 14, we can see that the native Germanic speaker obtained the highest fluency score generally and native Romance speaker has the lowest fluency score. The standard error bar of each group does not overlap with each other; it shows that the difference in mean fluency score of the three groups is significant.
