

Description
CartoDB is a cloud based mapping, analysis and visualization engine that lets users build spatial applications for both mobile and the web. Users input tabular data and then construct an interactive visualisation through the web interface. It provides automatic georeferencing functionality and provides APIs for mobile data collection and dissemination. Use is free for up to 5 tables. (Source)
Creator
Type(s) of DH Tool or Platform
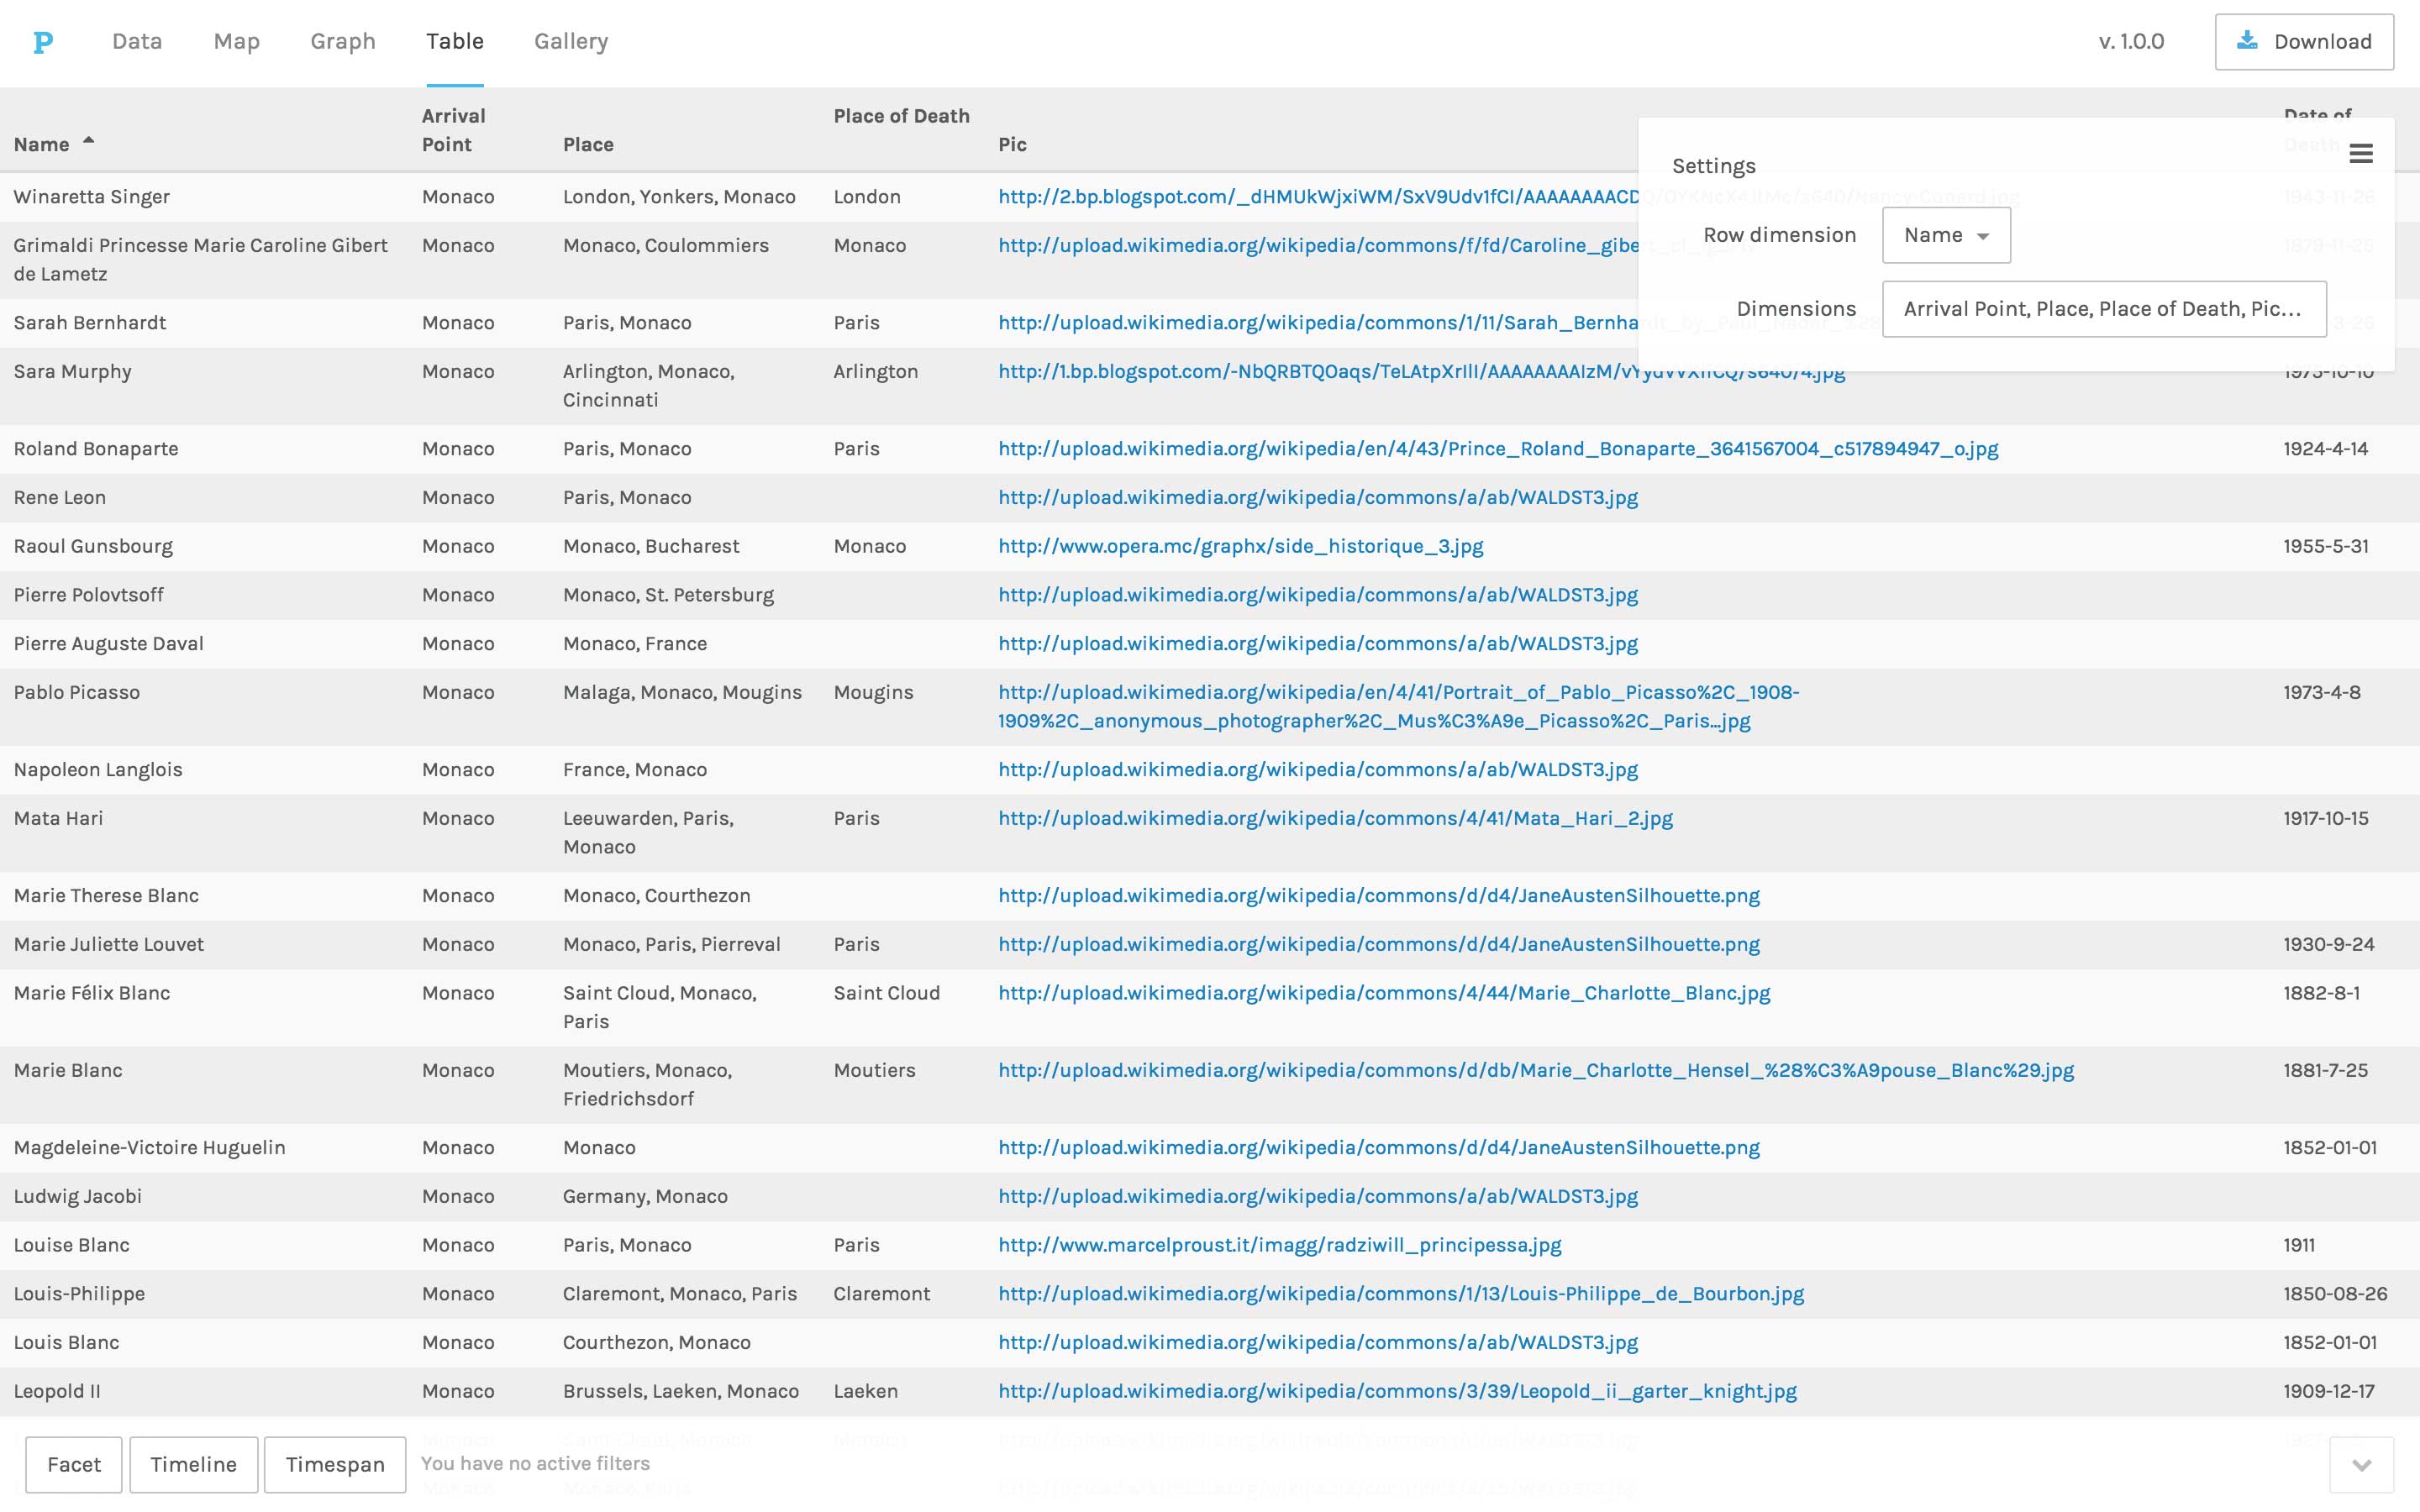
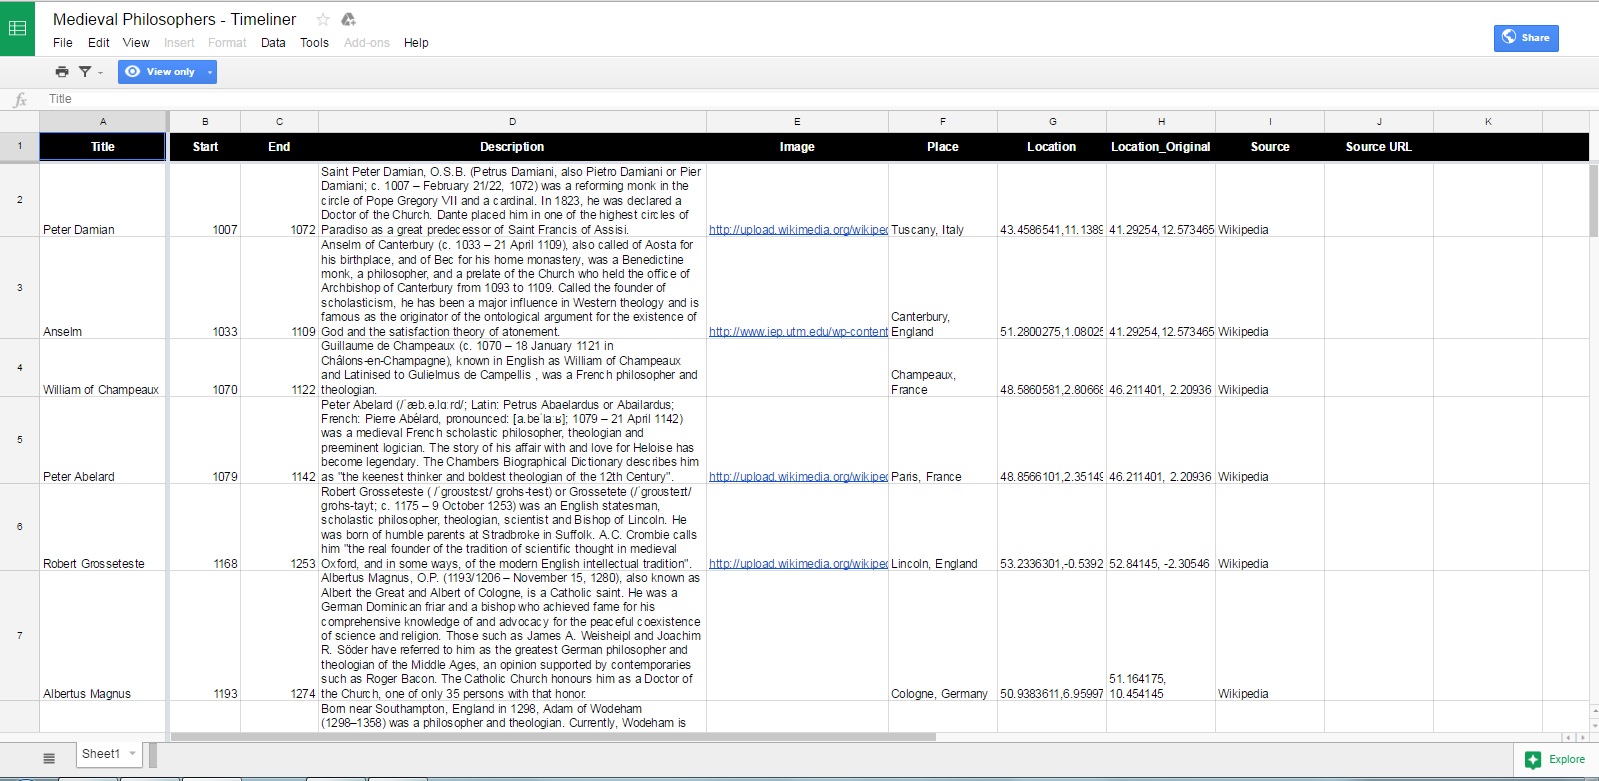
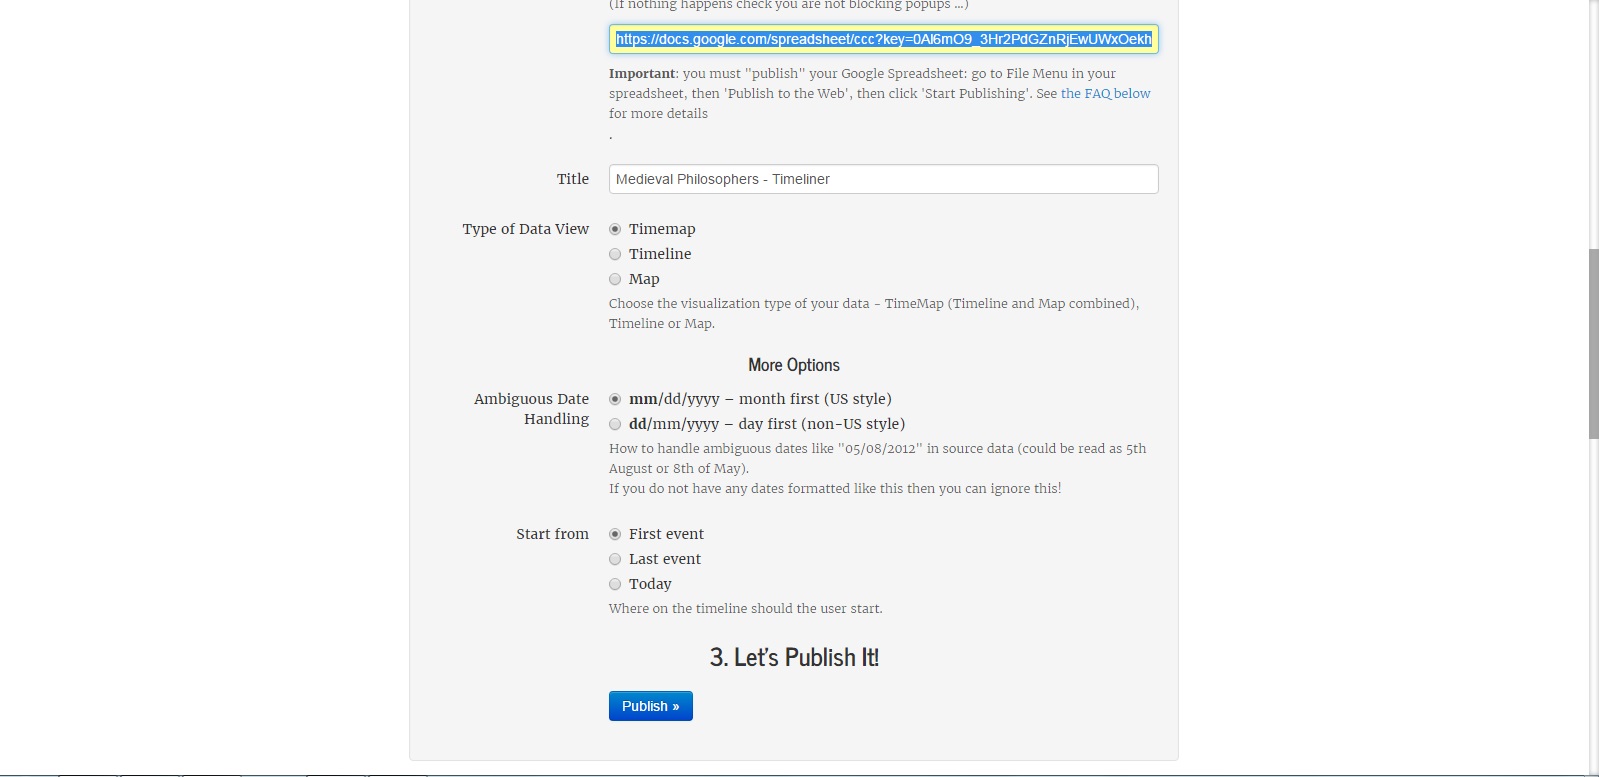
Screenshots of Platform

Map view – Selecting different types of map
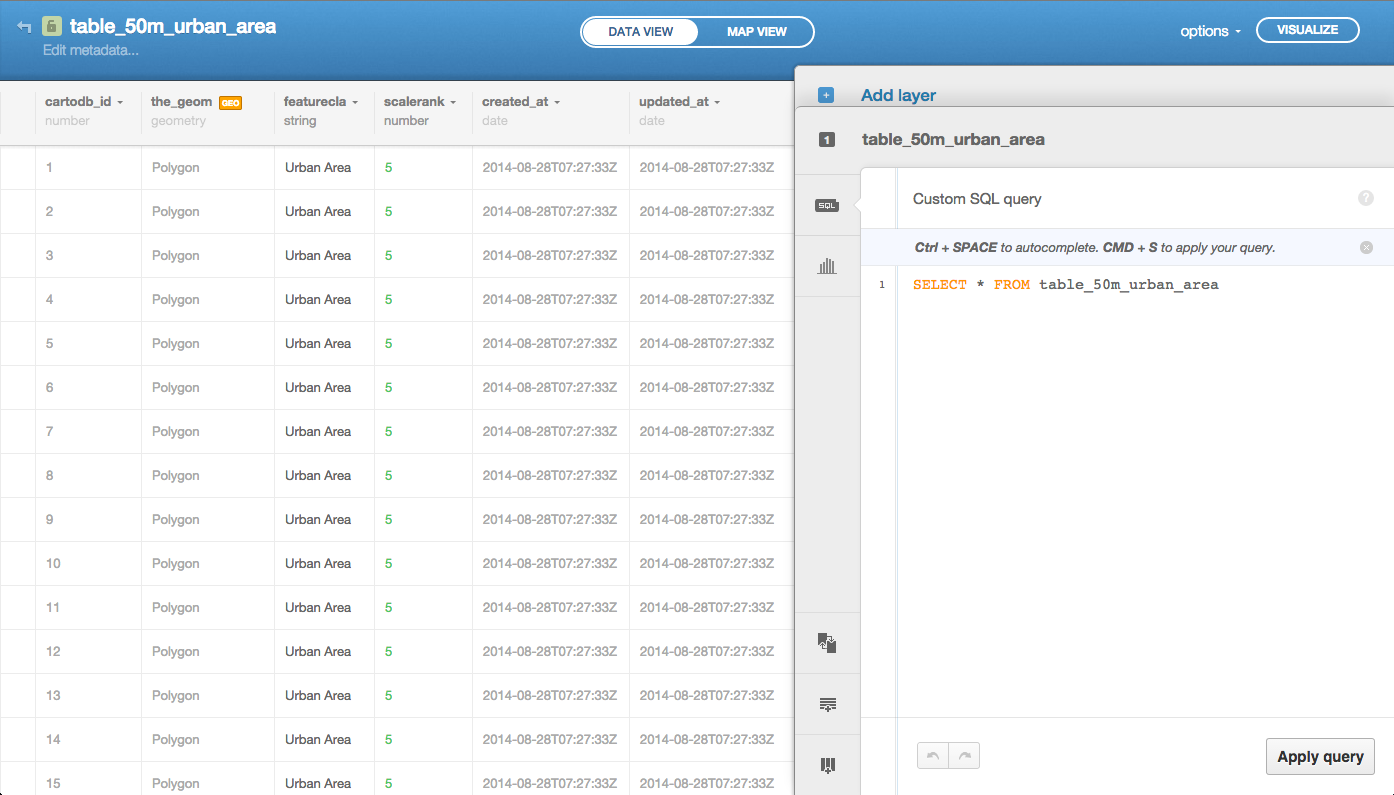
Data view – Selecting data range by SQL statements