

Image Source: People vector created by rawpixel.com
Digital storytelling is the use of digital media (images, videos etc.) and tools to tell a narrative. The use of digital storytelling tools can help us to present data stories and relationships more effectively.
Northwestern University Knight Lab is a community that brings together professionals and students to develop JavaScript-based digital storytelling tools. Their free, open-source tools enables anyone to produce highly interactive data visualization through their easy-to-use authoring tools, without the need for extensive coding knowledge. Knight Lab provides step-by-step instructions and tips on their site on how to build and share your visualization.
To get started, all you need is a Google account and of course, your data.
JuxtaposeJS
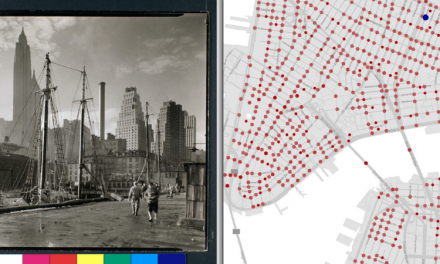
JuxtaposeJS enables users to compare two pieces of images or GIFs to highlight before/after or then/now narratives.
This tool has been used to compare the effects of Hurricane Irma on the British Virgin Islands by the Washington Post. Here’s one that we created of Lee Wee Nam Library when we took part in the #10yearchallenge, to show how much the library has changed!
How to create a JuxtaposeJS slider
Creating one is easy! All you need to do is host your two images, and paste the direct links into the authoring tool. You can also add labels to the two images.

Soundcite
With the use of Soundcite, you can add inline audio to your text narratives. Add sound clips of an event’s surrounding sounds to let readers experience its atmosphere, or snippets of an interview to bring your articles alive.

Soundcite application examples. Click to listen to the examples.
How to use Soundcite
Create one by uploading your audio to Soundcite in MP3, M4A, WMV or Ogg formats. Once uploaded, customize your audio by specifying the start and end time of the clip. After which, embed the clip to your page by following the instructions provided in step 3.


StoryMapJS & TimelineJS
StoryMapJS highlights the locations of events in a story. Creating one is easy, as all you have to do is upload your images and input your content into the authoring tool.
TimelineJS enables you to build an interactive timeline through their customized Google Sheets. In the sheet, you can specify event dates, add different types of media and even customize the background color of each page.
We wrote an extensive post to guide you on using these tools entitled ‘Enhance Your Presentations With Digital Storytelling Tools’.
Beta Projects
Apart from these tools, Knight Lab also experiments with upcoming technology and continues to develop more tools to aid digital storytelling. Here are some of their projects that are still in Beta stage.

SceneVR enables users to create unique 360° narratives by turning collections of panoramic and VR-ready photos into a slideshow of navigable scenes with text descriptions. Here’s a demo.
SensorGrid is a project developed to help monitor urban air quality “accurately, affordably and efficiently”, while StorylineJS enables users to create an interactive, annotated line chart.
What other digital tools are you using? Let us know in the comments below.
Be sure to check out other posts tagged Digital Scholarship, follow us @NTUsgLibrary and our hashtag #NTUsgLibraryDS on Twitter for more interesting tools and projects!


